

Cardano (ADA) is moving lower below the $0.500 resistance zone. ADA could gain bearish momentum and decline if it stays below the 100 SMA (H4).
- ADA price is slowly moving lower from the $0.520 zone.
- The price is trading below $0.500 and the 100 simple moving average (4 hours).
- There is a key bearish trend line forming with resistance at $0.4740 on the 4-hour chart of the ADA/USD pair (data source from Kraken).
- The pair could attempt a fresh increase if the bulls remain active above the $0.4280 support.
Cardano Price Faces Key Hurdles
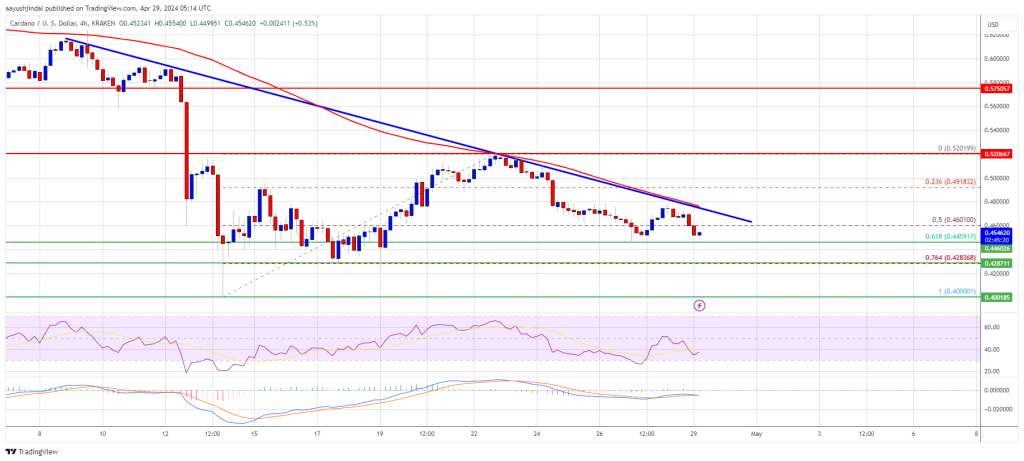
In the past few days, Cardano saw a steady decline from the $0.520 resistance zone, like Bitcoin and Ethereum. ADA price declined below the $0.500 and $0.4950 levels to enter a bearish zone.
There was a move below the 50% Fib retracement level of the upward move from the $0.4000 swing low to the $0.5201 high. It even declined below $0.4650 and tested $0.450. The price is now trading below $0.500 and the 100 simple moving average (4 hours).
There is also a key bearish trend line forming with resistance at $0.4740 on the 4-hour chart of the ADA/USD pair. The bulls seem to be active near the $0.450 zone and the 61.8% Fib retracement level of the upward move from the $0.4000 swing low to the $0.5201 high.
On the upside, immediate resistance is near the $0.4740 zone, the 100 simple moving average (4 hours), and the trend line. The first resistance is near $0.4920. The next key resistance might be $0.500. If there is a close above the $0.50 resistance, the price could start a strong rally.
Source: ADAUSD on TradingView.com
In the stated case, the price could rise toward the $0.5250 region. Any more gains might call for a move toward $0.5650.
More Losses in ADA?
If Cardano’s price fails to climb above the $0.4740 resistance level and the 100 simple moving average (4 hours), it could continue to move down. Immediate support on the downside is near the $0.450 level.
The next major support is near the $0.4280 level. A downside break below the $0.4280 level could open the doors for a test of $0.40. The next major support is near the $0.3880 level.
Technical Indicators
4 hours MACD – The MACD for ADA/USD is gaining momentum in the bearish zone.
4 hours RSI (Relative Strength Index) – The RSI for ADA/USD is now below the 50 level.
Major Support Levels – $0.4500, $0.4280, and $0.4000.
Major Resistance Levels – $0.4740, $0.5000, and $0.5200.
Disclaimer: The article is provided for educational purposes only. It does not represent the opinions of NewsBTC on whether to buy, sell or hold any investments and naturally investing carries risks. You are advised to conduct your own research before making any investment decisions. Use information provided on this website entirely at your own risk.