

Bitcoin is trending higher at spot rates, breaching $63,000 on June 30 before recoiling. Even though momentum is building, the action of the coin’s price is a source of debate. Still, some are doubtful, thinking there is reason for a possible overvaluation.
Analyst: Bitcoin Is Overvalued, Here’s Why
In a post on X, one analyst argues that the coin may likely cool off, extending the 18% drop registered in June. To conclude this, the analyst said the preview factored in several parameters, including time, the number of active Bitcoin addresses, and hash rate.
Through this model, the analyst said there was reason to doubt the uptrend, dampening the spirits of optimistic holders expecting bulls to push on. As of writing, Bitcoin is back in the multi-week range with caps at all-time highs and support at $56,800 registered in May.
Related Reading
From price action, it is clear that buyers are in charge, at least from a top-down preview. Despite the lower lows, especially in May when prices breached $60,000, bulls have a chance from a top-down preview.
Notably, prices are inside a bull flag after gains in Q1 2024. However, buyers’ failure to confirm gains in mid-March is slowing down the uptrend.
Buyers have failed to breach $74,000 from the daily chart, and $72,000 is a strong liquidation line. In the short term, the trend could shift if prices break out decisively above $66,000, preferably at the back of rising trading volume.
Germany Selling As BTC Gains Versus M1 Money Supply In The United States
Further fueling concerns is the recent dump by the German government. On July 1, they transferred 1,500 BTC, worth over $94 million. Lookonchain data shows 400 BTC were sent to three exchanges, including Bitstamp.
Though it is not immediately clear if they sold, sending them to exchange means they are keen on offloading them–a net bearish. The address associated with the German government currently holds over 44,000 BTC worth more than $2.5 billion at spot rates.
Even amid these concerns, others are bullish on BTC. Citing the relationship between the United States M1 money supply and BTC prices, one analyst said the coin is priming for major gains.
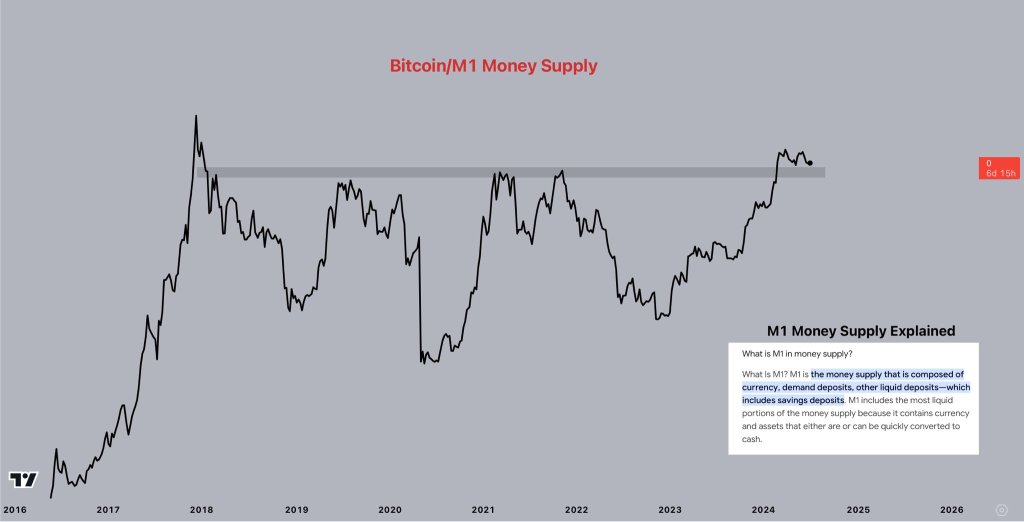
Looking at the chart, the analyst argues that Bitcoin has not reached a new all-time high relative to the United States M1 money supply in over six years.
Related Reading
However, considering the steady surge in BTC prices since mid-2023, it is highly likely that bulls will take over, pushing the coin to fresh all-time highs.
Feature image from DALLE, chart from TradingView